Analyzing 18 Years Of NHL Data To Solve My Niche Problem
The NHL is known to be the sport most dominated by luck/randomness compared to other professional sport leagues. Well, I have been playing fantasy hockey for 14 years. Our league is points-based, as opposed to categories, and so there comes a day at the end of our weekly matchup where I am scouring the waiver wire for a pickup to try and win the week. I always ask myself “Who do I think is going to score today?”. There are a lot of different factors acting against me being correct, including luck and a lack of caffeine, but I am normally wrong.
I always wished I could just be correct 100% of the time. 100% is unattainable, but I was curious, is there a way to be better and optimize my pickups?
My process typically goes as such:
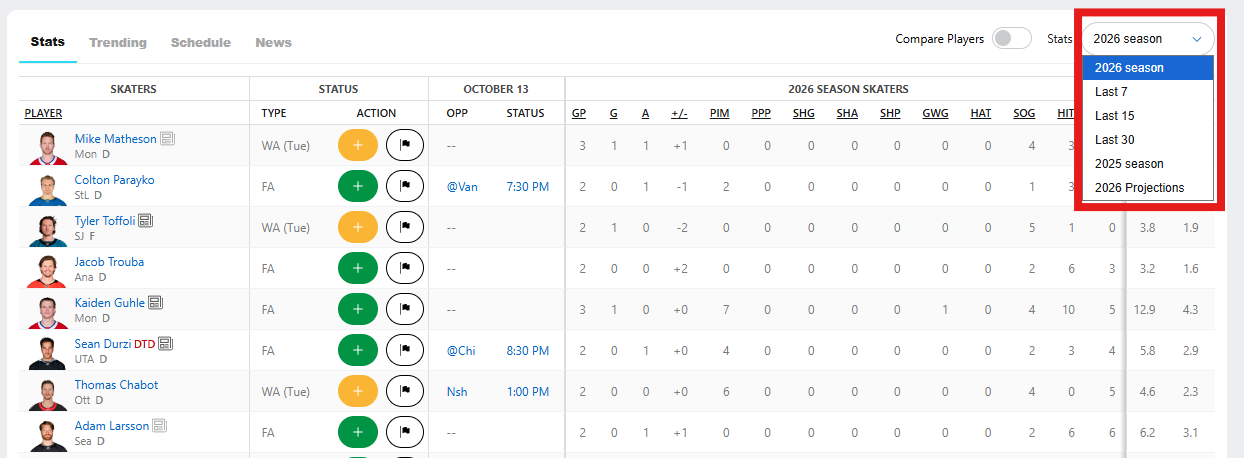
- Look at all the players playing today on the waiver wire
- Sort by highest average fantasy points
- Select that player
Steps 1 & 3 are straightforward, but step 2 intrigued me. I always held a theory that recent performance would better predict future performance better than season-long stats. Was this true? What is recent? 1 game? 5 games? So I started investigating.
The dataset I used was gathered from the NHL’s public API. It consists of player’s box score stats for every regular season game from 2007-2025. I targeted actual NHL game points (not fantasy scoring) to keep the model generalizable and I focused on using if a player got 1+ points as the target variable. Doing so turned this problem into a categorical problem(0 points or 1+ points) rather than a continuous numerical value(0, 1, or 2)
My goal was to find the optimal lookback window(number of games) to consider when predicting if a player would score. I tested 15 different lookback windows: [1, 2, 3, 5, 7, 10, 12, 15, 18, 20, 25, 30, 35, 40, 50]
I ended up using the following variables for the prediction:
- Average points
- Average power play points
- Average shots
- Average time on ice I just want to reiterate that the variables were chosen from box score stats and I do have some experience with these types of predictions before so I knew that these would perform fairly decent.
Tying it all together, for each window:
- I grouped each player by their game logs and sorted their games by date
- Calculated different aggregate stats for each window
- Ran a prediction algorithm to try and predict whether a player got a point or not
The outputs were then collected and charted against each other.
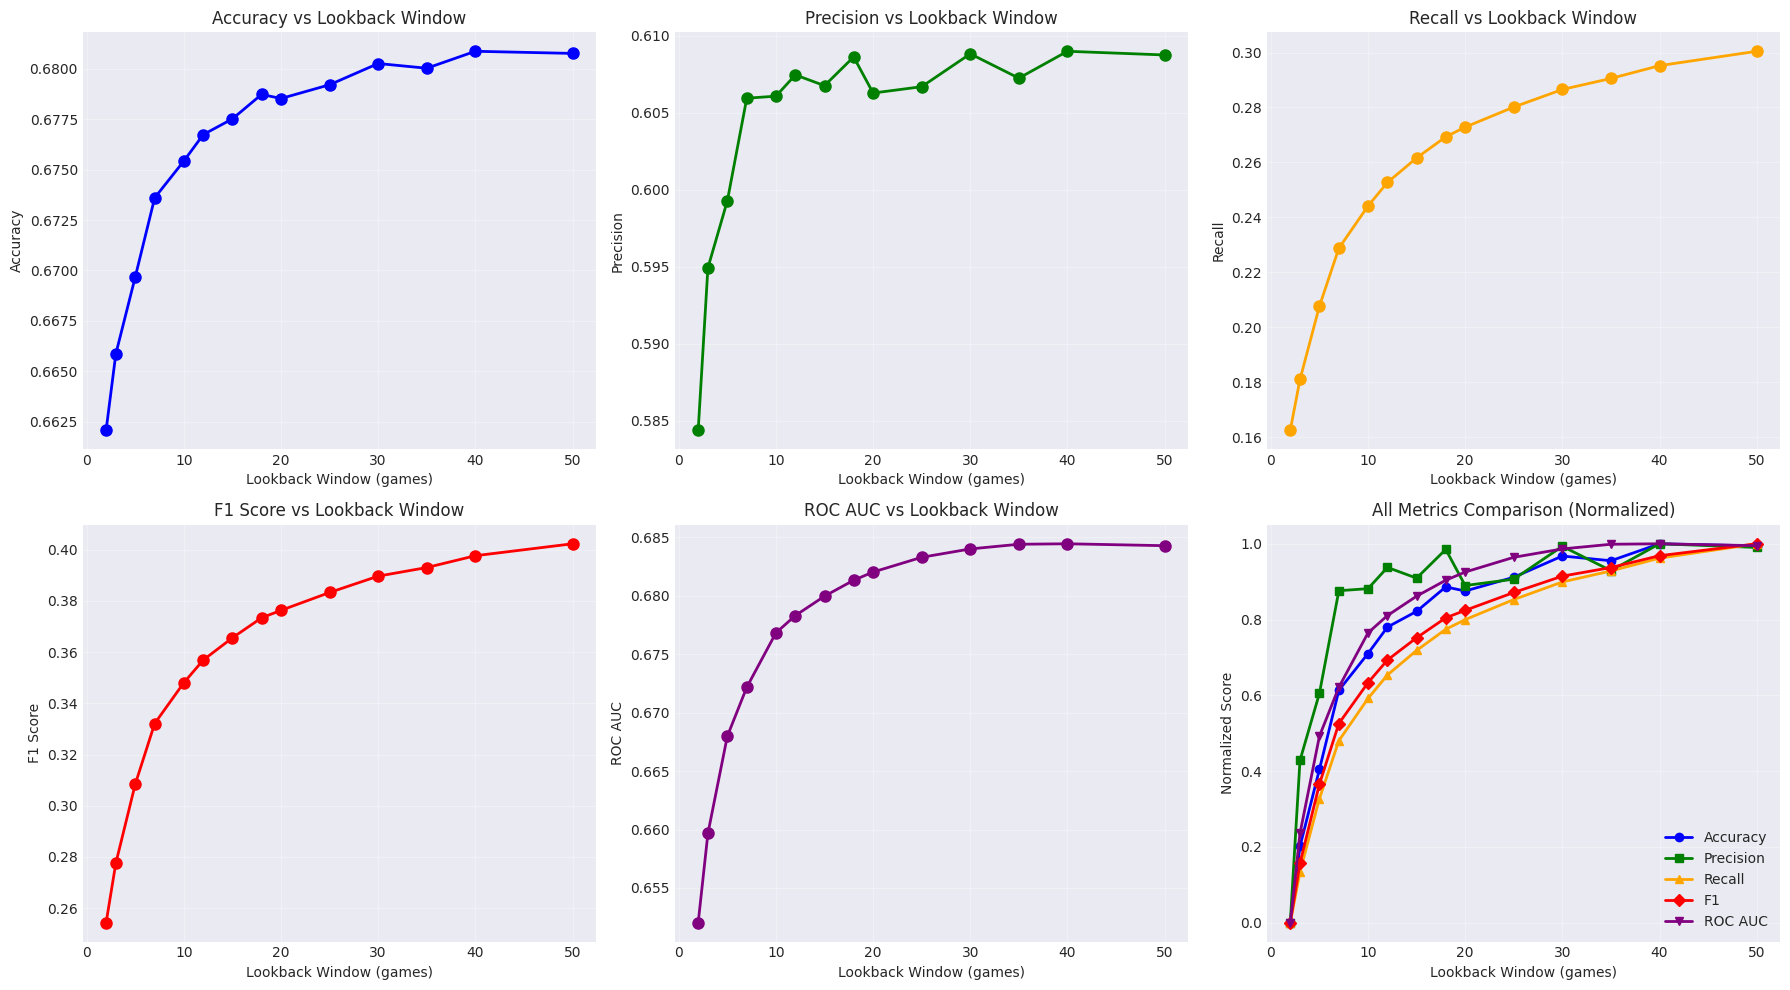
Over time, it does appear that the larger sample sizes win out. I think this is somehow both obvious and a little surprising. The concept of “hot” and “cold” streaks play out across all sports leagues so I thought there may be a chance that very recent history may carry more weight but the medium term seems to win out.
So it’s easy, if you want to figure out which player is most likely to score on any given night, look at their season performance.
I find this answer unsatisfying for a couple of reasons.
- Some of the most important pickups you can make in fantasy happen early on in the season so sometimes you aren’t always going to have 50 games+ of history
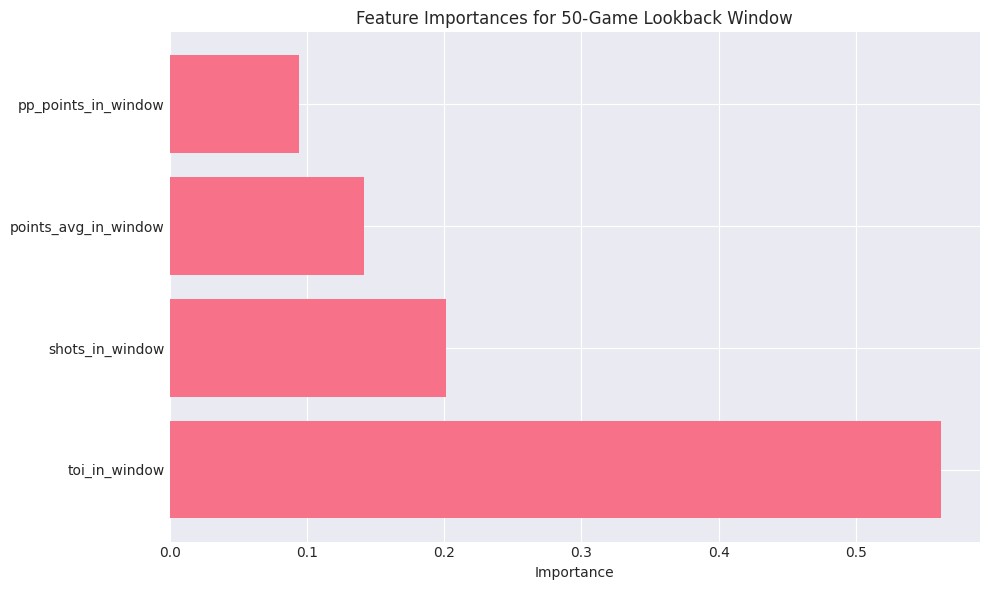
- Ice time is by far the most important variable and this can be one of the more sensitive values for a player depending on if they get moved up or down in the lineup or injuries
An interesting note about the results is that as the window increases, the usefulness actually goes down. Beyond 50 games, we begin to see a tail off for every metric.
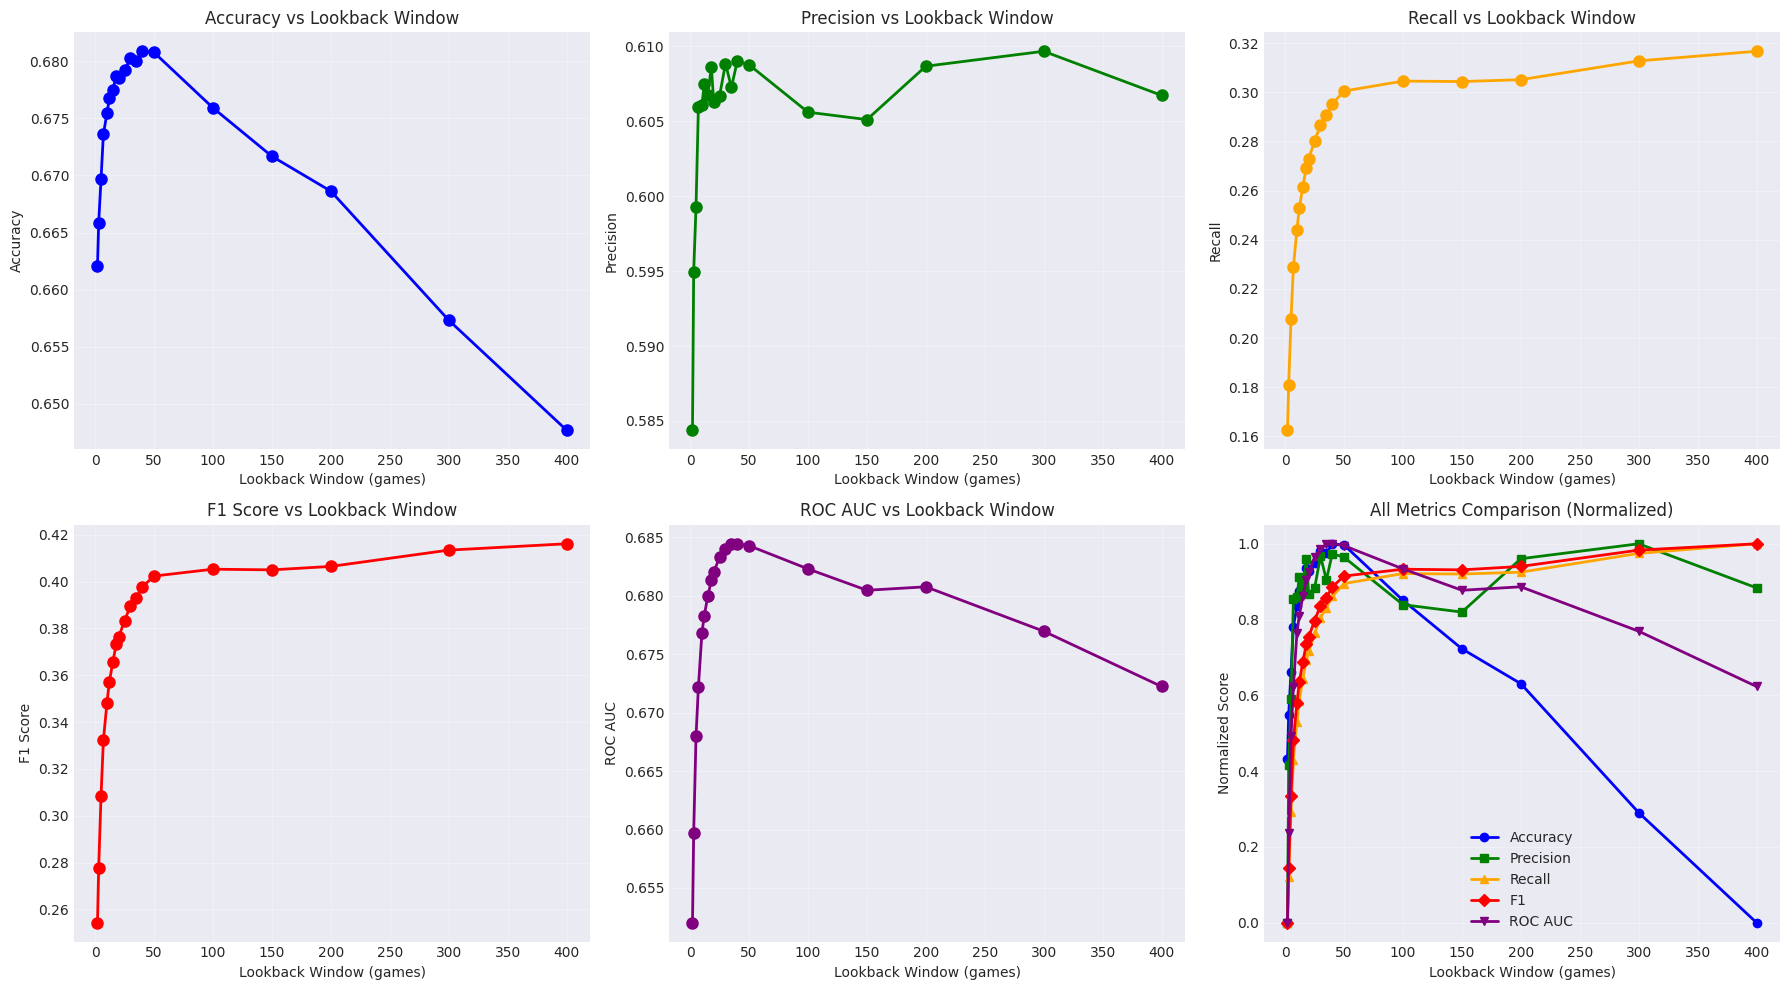
It appears that over time, macro effects emerge: team changes, roster quality shifts, and age-related decline.
Focusing on our original batch of windows, we can take advantage of the almost logarithmic nature of the graph. Expanding one of the graphs from above, this is the F1 score plotted with the lookback windows.
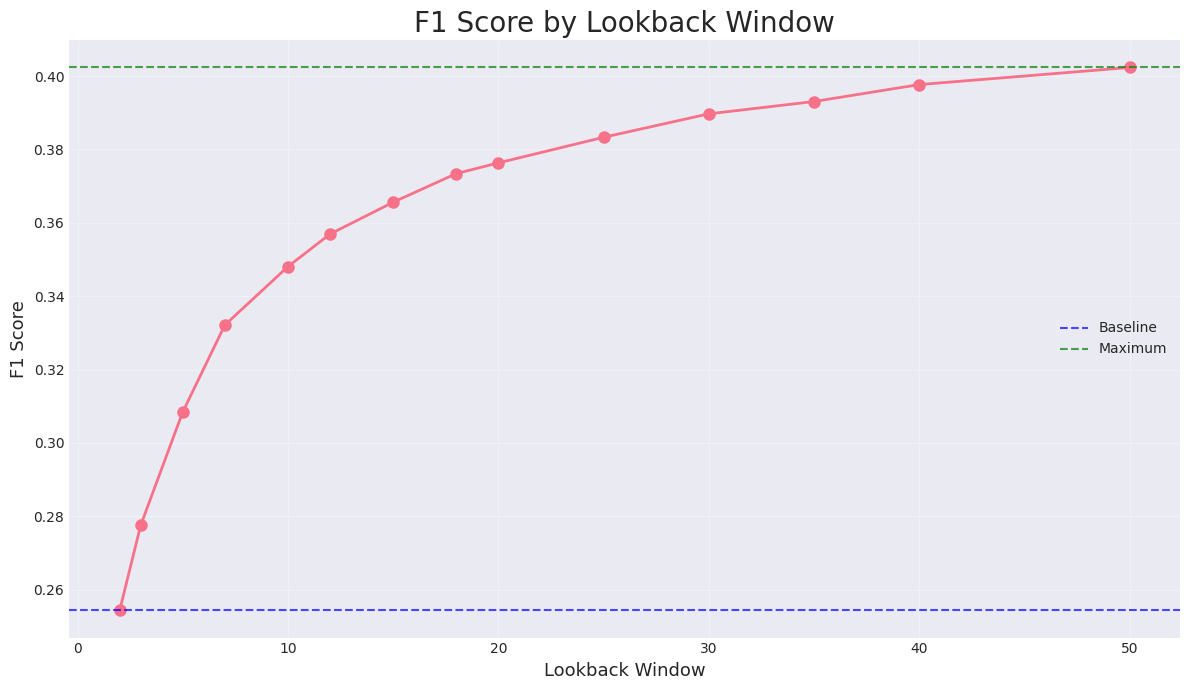
Let’s assume that the peak usefulness is at 50 games. Doing this lets us clamp the F1 score between the min and max values on the graph. From there, we can attribute a “percentage gained” value for each lookback window. This essentially describes the amount each window contributes to the “maximum” F1 score.
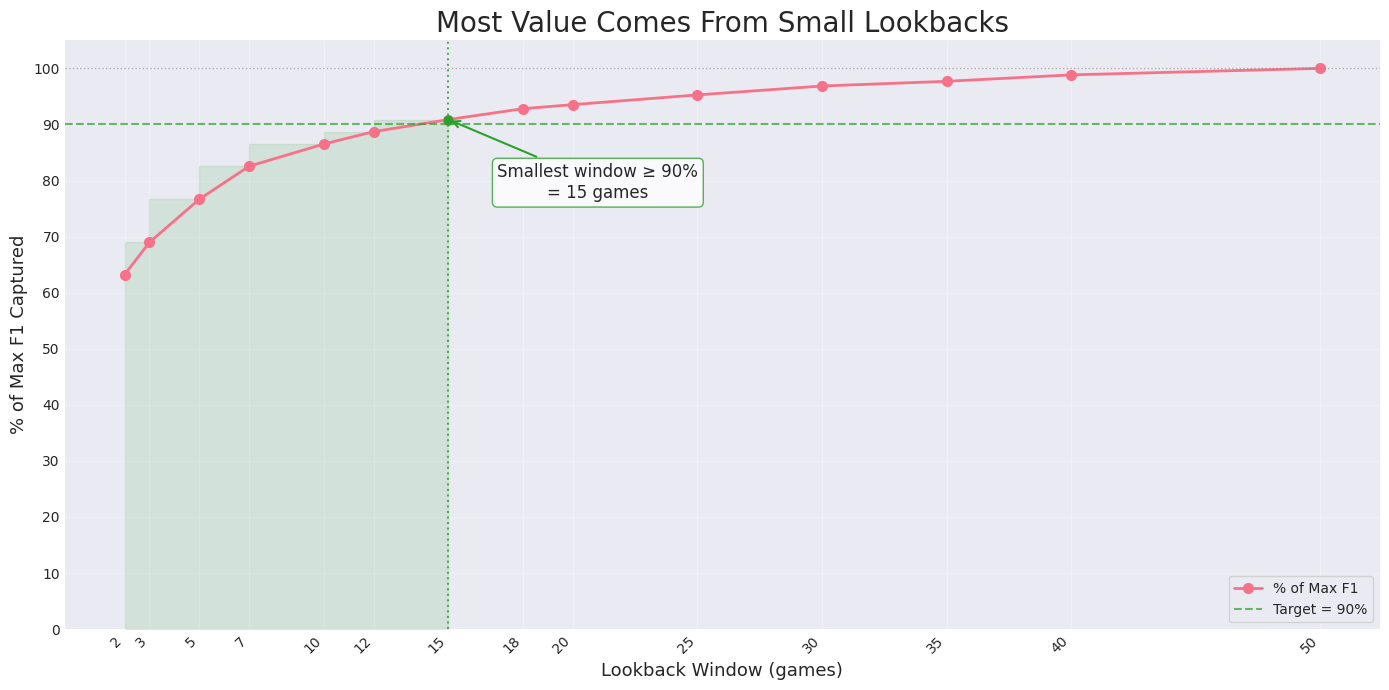
So ~90% of our max value can be attained by just looking at the past 15 games. Conveniently, teams in the NHL play ~1 game every 2 days so this tells us the most predictive time range to look at for how a player has performed is over the past month.
Thank you for coming on this journey with me and go forth with this information and dominate your fantasy hockey leagues.